
Client Education Event Recap
Anytime we get to spend time with our clients, it is so humbling. We thoroughly enjoy helping our clients navigate their life moments and providing some peace of mind as life moves in different directions. However, serving hundreds of households doesn’t really sink in until you bring them together and fill an entire room! It’s a wonderful reminder of the impact we can have by striving to help clients with their financial needs and educating them on a variety of financial topics.
We typically hold client education events at least once a year, and in March we focused our education on the markets. Here are a few highlights, in case you missed it:
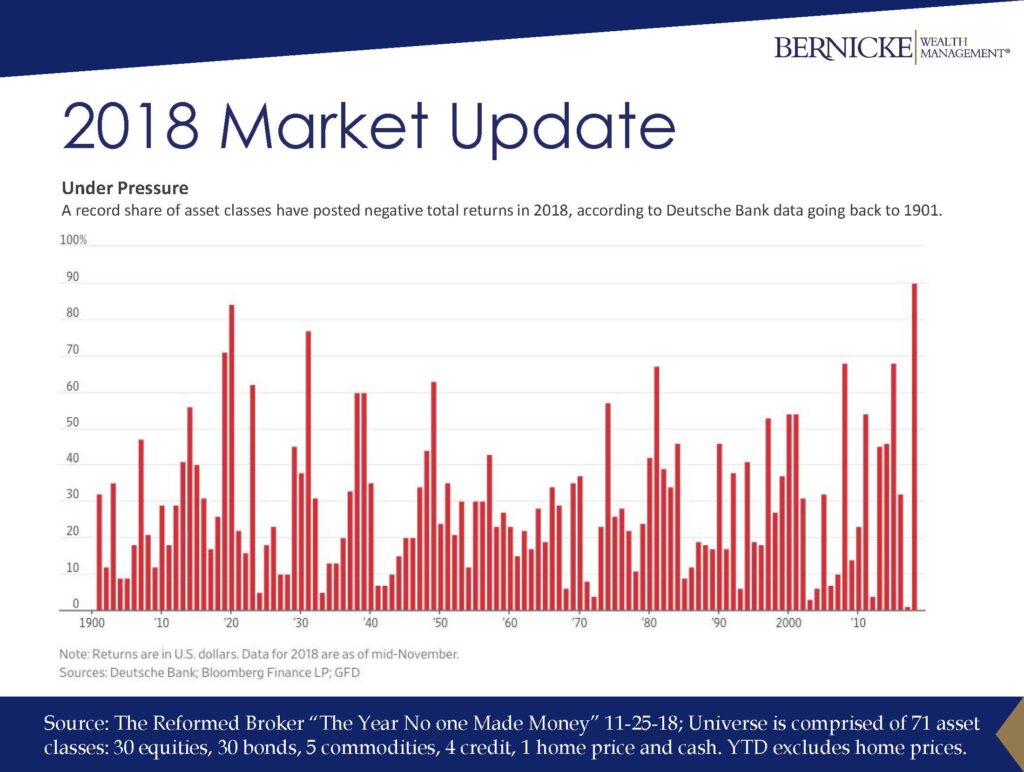
2018 Market Update
In what should be no surprise to any investor, 2018 markets were down overall.

In fact, nearly 90% of the 71 asset classes tracked by Deutsche Bank and Bloomberg Financial were negative, the highest that statistic has been since 1900.
Headwinds that seem to have impacted the markets included:
- Interest Rate Hikes – In 2018 there were four interest rate hikes by the Federal Reserve. When interest rates are high it can have the tendency to help slow the economy down, which in turn can potentially help slow the stock market down.
- Tariffs – There has historically been a disparity between what we charge other countries and what other countries charge us for all traded goods. This past year we saw the current administration make an effort to try to close the gap between what we charge and what the other countries charge. In the short term, this had a negative impact on the stock market due to potential fears of trade wars.
- Mid-term Elections – Stock markets, as measured by the S&P 500® index, have not historically done well in the months leading up to mid-term elections in the years the mid-term elections occur. However, if you look at the one-year return of the S&P 500® following the years when there are midterm elections, historically speaking, the markets have done better than when compared with all other years that do not have midterm elections. We talked about this in a related article Does History Repeat Itself.
As we looked at the current state of the markets, we could get some insights for the future, based on history:
- If you look at the current Forward PE ratio of the stock market, as measured by the S&P 500®, (PE ratio is something that has been used to value how expensive or inexpensive the stock market actually is), presently it’s in that 15-16 range. According to The Capital Group, when the current PE ratio of the stock market is in that range, the markets tends to have, on average, a 7.1% rate of return for the subsequent five years, historically speaking. This does not ensure that that will happen in the future but it’s designed to give you an idea of what has happened in the past.
- When looking at cumulative U.S. GDP growth for expansions and recessions (%), the average recession only lasted about 11 months. The average expansion of the economy, as measured by the GDP, was 67 months. During that time, historically speaking, the markets have had prolonged periods of upswings when compared with a recession and the markets have been much more flat / down in value. Again this is no predictor of the future but is designed to give you a general understanding of how markets in the economy grow and shrink.
- High-quality bonds, as measured by intermediate term government bonds, have certainly gone down in value in many different years in the past, but generally speaking, the downturns are much less than those associated with the stock market. It’s interesting, however, to look at the five worst years for bonds since 1926, and then see the subsequent year’s returns.

Perhaps, a Little Peace of Mind
It’s not uncommon to wonder if your portfolios are still aligned with what you’re trying to achieve. This is the reason we have reviews, analyze your portfolio during the course of the year, and reach out to you or address a portfolio that isn’t aligned with your objectives if we see that something doesn’t appear to be working as intended.
Behind the scenes we’re frequently doing research on our clients’ behalf. For our portfolios that are discretionarily managed, we make adjustments as we feel are needed. We also develop and monitor tax-sensitive financial strategies designed to intelligently help control current and future tax implications, and strive to help you keep your estate aligned with your objectives. We put great effort into this on your behalf.
Questions?
If you have questions about the material covered at the education event, please don’t hesitate to reach out to your adviser or bring your questions up at your next review. We truly enjoy serving you as our clients and our friends.
Definitions:
Barclays US Aggregate Bond The Bloomberg Barclays US Aggregate Bond Index is a broad-based flagship benchmark that measures the investment grade, US dollar-denominated, fixed-rate taxable bond market. The index includes Treasuries, government-related and corporate securities, MBS (agency fixed-rate and hybrid ARM pass-throughs), ABS, and CMBS (agency and non-agency).
MSCI EAFE The MSCI EAFE Index is designed to represent the performance of large and mid-cap securities across 21 developed markets, including countries in Europe, Australasia, and the Far East, excluding the U.S. and Canada. The Index covers approximately 85% of the free float-adjusted market capitalization in each of the 21 countries.
MSCI EM The MSCI Emerging Markets Index consists of 24 developing countries* representing approximately 10% of world market capitalization. The Index covers approximately 85% of the free float-adjusted market capitalization in each of the 24 countries.
MSCI World EX USA The MSCI World EX USA Index captures large and mid cap representation across 22 of 23 Developed Markets (DM) countries*–excluding the United States. With 1,012 constituents, the index covers approximately 85% of the free float-adjusted market capitalization in each country.
Russell 2000 The Russell 2000 Index measures the performance of the small-cap segment of the U.S. equity universe. The Russell 2000 Index is a subset of the Russell 3000® Index, representing approximately 8% of the total market capitalization of that index. It includes approximately 2,000 of the smallest securities.
S&P 500® The S&P 500® is a market capitalization-weighted index of large-cap U.S. equities. The index includes 500 leading companies and captures approximately 80% coverage of available market capitalization.
FTSE World Government Bond Index (WGBI) The FTSE World Government Bond Index (WGBI) measures the performance of fixed-rate, local currency, investment-grade sovereign bonds. The WGBI is a widely used benchmark that currently includes sovereign debt from over 20 countries, denominated in a variety of currencies, and has more than 30 years of history available. The WGBI provides a broad benchmark for the global sovereign fixed income market. Sub-indexes are available in any combination of currency, maturity, or rating.
TR = Total Return NR = Net Return PR = Price Return USD = U.S. Dollar
* EM countries include: Brazil, Chile, China, Colombia, Czech Republic, Egypt, Greece, Hungary, India, Indonesia, Korea, Malaysia, Mexico, Pakistan, Peru, Philippines, Poland, Russia, Qatar, South Africa, Taiwan, Thailand, Turkey and United Arab Emirates. Source: https://www.msci.com/documents/10199/c0db0a48-01f2-4ba9-ad01-226fd5678111
Disclosures:
Past performance is no guarantee of future results and may have been impacted by events and economic conditions that will not prevail in the future. Investing involves gains and losses and may not be suitable for all investors. Investors should be prepared to bear potential losses, including the loss of principal.
The information contained in this article does not purport to be a complete description of any securities, markets or developments referred to herein. Certain information contained in this article is derived from sources that we believe to be reliable; however, Bernicke does not guarantee the accuracy, suitability, completeness, relevance or timeliness of such information, whether linked to or incorporated herein, and assumes no liability for any resulting damages. The information presented herein is subject to change without notice and should not be considered as a solicitation to buy or sell any security. All such information is provided solely for convenience purposes only and all users thereof should be guided accordingly. There is no guarantee that the views and opinions expressed in this article will come to pass.
Bernicke may recommend clients engage the firm for additional related services, its Supervised Persons in their individual capacities as insurance agents or registered representatives of a broker-dealer and/or other professionals to implement its recommendations. Clients are advised that a conflict of interest exists if clients engage the firm or its affiliates to provide additional services for compensation.
Any reference to a market index is included for illustrative purposes only, as it is not possible to directly invest in an index. Indices are unmanaged, hypothetical vehicles that serve as market indicators and do not account for the deduction of management fees or transaction costs generally associated with investable products, which otherwise have the effect of reducing the performance of an actual investment portfolio.